Temperature
This section demonstrates how we use shaders to visualize temperature data. The data is fetched from a tile server and rendered using WebGL shaders.
Temperature Data
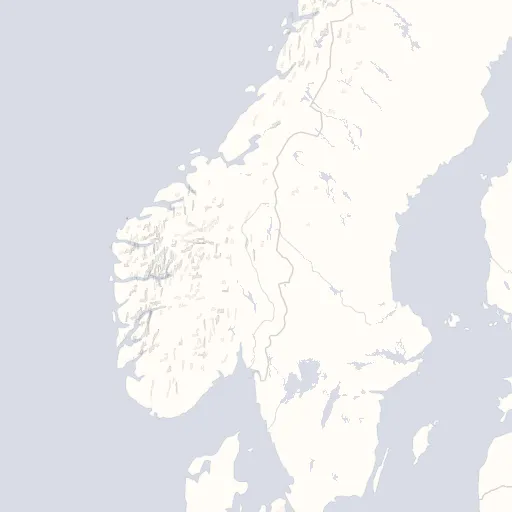
Temperature data is retrieved from a tile server that provides XYZ tiles containing temperature values. For simplicity, we use static images for both the temperature data and the map background. The image below consists of multiple tiles stitched together to create a larger image. In the next example, we will use WebGL to render this data alongside our background map.

Rendering Raw Temperature Data with WebGL
Setting up WebGL requires some boilerplate code, which is omitted in these simplified examples. If you are unfamiliar with WebGL, we recommend visiting WebGL Fundamentals for an introduction. Once a canvas element is created and the WebGL context is set up, we can begin writing shaders.
Vertex Shader
attribute vec2 aPosition;
attribute vec2 aTexCoords;
uniform vec2 uResolution;

varying vec2 vTexCoord;

void main() {
   // convert the rectangle from pixels to 0.0 to 1.0
   vec2 zeroToOne = aPosition / uResolution;

   // convert from 0->1 to 0->2
   vec2 zeroToTwo = zeroToOne * 2.0;

   // convert from 0->2 to -1->+1 (clipspace)
   vec2 clipSpace = zeroToTwo - 1.0;

   vTexCoord = aTexCoords;
   gl_Position = vec4(clipSpace * vec2(1, -1), 0, 1);

   // pass the texCoord to the fragment shader
   // The GPU will interpolate this value between points.
}
A simple vertex shader that provides the texture coordinates to the fragment shader.
Fragment Shader
precision mediump float;

// our texture
uniform sampler2D uDataTexture; // Texture containing the temperature data
uniform sampler2D uMapTexture; // Texture containing the background map

varying vec2 vTexCoord;

void main() {
      // Calling texture2D to get the color of the temperature data and the background map
      vec4 temperatureDataColor = texture2D(uDataTexture, vTexCoord);
      vec4 mapTextureColor = texture2D(uMapTexture, vTexCoord);

      // Blend the colors by multiplying them
      gl_FragColor = temperatureDataColor *  mapTextureColor;
}
The fragment shader samples texture coordinates (vTexCoord) to determine the color representation in
both the temperature data and the background map. To blend these colors, we multiply them together.
Output
The result is drawn onto our canvas element.
Applying a Custom Color Gradient
The raw temperature data is not easily readable, as it only contains temperature values stored in the R channel of the image. To improve readability, we apply a custom color gradient using the fragment shader. The vertex shader remains unchanged.
Applying a custom color gradient.
Fragment Shader Modifications
Instead of displaying the raw data, we map the temperature values to a color gradient. We achieve this by adding:
uniform sampler2D uColorGradientTexture- Extracting the R value from
uDataTexture, which contains the temperature information.
precision mediump float;

// our texture
uniform sampler2D uDataTexture;
uniform sampler2D uMapTexture;
uniform sampler2D uColorGradientTexture;

varying vec2 vTexCoord;

void main() {
    // Getting temperature data from the temperature data texture,
    // and getting the color from the backgroundmap texture
    vec4 temperatureData = texture2D(uDataTexture, vTexCoord);
    vec4 mapTextureColor = texture2D(uMapTexture, vTexCoord);

    // In this example the color gradient is moving from left to right, where the color on the
    // far left represents the coldest value and far right the warmest, so we can use the
    // r-value directly since it represents the temperature
    vec4 temperatureColor = texture2D(uColorGradientTexture, vec2(temperatureData.r, 0.0));

    gl_FragColor = temperatureColor * mapTextureColor;
}
Output
After modifying the fragment shader, the temperature data is now visualized using our custom color gradient.